
Benchmark DUACS Lagrangian Cumulative Distance
2023-04-27 DUACS_SSH_BENCHMARK_DEMO
Authors: CLS & Datlas Copyright: 2023 CLS & Datlas License: MIT
Benchmark of DUACS sea surface height maps
Benchmark of DUACS sea surface height maps
The notebook aims to evaluate the sea surface height maps produced by the DUACS system.
<h5> These maps are equivalent to the SEALEVEL_GLO_PHY_L4_MY_008_047 product distributed by the Copernicus Marine Service, except that a nadir altimeter (SARAL/Altika, SEALEVEL_GLO_PHY_L3_MY_008_062 product) has been excluded from the mapping. </h5>
    <h5> We provide below a demonstration of the validation of these maps against the trajectories of independent drifters distributed by CMEMS </h5>
1. Import packages
[1]:
import os
import numpy as np
import xarray as xr
import matplotlib
import matplotlib.pylab as plt
import matplotlib.ticker as mticker
import cmocean
from scipy.interpolate import RegularGridInterpolator
import pickle
import gc
from matplotlib import cm
import warnings
warnings.filterwarnings('ignore')

%matplotlib inline

import sys
sys.path.append('..')
from src.mod_plot import *
from src.mod_traj import *
from src.mod_compare import regional_zoom
2. Setup parameters
[4]:
method_name = 'DUACS_global'

time_min = '2019-01-01'                                        # time min for analysis
time_max = '2019-12-31'                                        # time max for analysis

dir_out = f'../results/'                               # output directory path
prefix_out = 'dict_drifter_adv'
results_out = 'deviat_uv_'+method_name+'.nc'

if not os.path.exists(dir_out):
    os.system('mkdir '+dir_out)

# Global
lon_min = 0                                          # domain min longitude
lon_max = 360                                          # domain max longitude
lat_min = -90.                                          # domain min latitude
lat_max = 90.                                          # domain max latitude
3. Maps to evaluate
3.1 Download maps
[5]:
path_maps =  f'../data/maps/DUACS_global_allsat-alg/dt*'

maps = xr.open_mfdataset(path_maps)

maps = maps.sel({'longitude':slice(lon_min-0.5,lon_max+0.5)})
maps = maps.sel({'latitude':slice(lat_min-0.5,lat_max+0.5)})
maps
[5]:
<xarray.Dataset>
Dimensions:    (latitude: 720, longitude: 1440, time: 365)
Coordinates:
  * latitude   (latitude) float32 -89.88 -89.62 -89.38 ... 89.38 89.62 89.88
  * longitude  (longitude) float64 0.125 0.375 0.625 0.875 ... 359.4 359.6 359.9
  * time       (time) datetime64[ns] 2019-01-01 2019-01-02 ... 2019-12-31
Data variables:
    sla        (time, latitude, longitude) float64 dask.array<chunksize=(1, 720, 1440), meta=np.ndarray>
    ugosa      (time, latitude, longitude) float64 dask.array<chunksize=(1, 720, 1440), meta=np.ndarray>
    vgosa      (time, latitude, longitude) float64 dask.array<chunksize=(1, 720, 1440), meta=np.ndarray>
    adt        (time, latitude, longitude) float64 dask.array<chunksize=(1, 720, 1440), meta=np.ndarray>
    ugos       (time, latitude, longitude) float64 dask.array<chunksize=(1, 720, 1440), meta=np.ndarray>
vgos (time, latitude, longitude) float64 dask.array<chunksize=(1, 720, 1440), meta=np.ndarray>3.2 Retrieve maps info
[6]:
time = maps.time.values
lon = maps.longitude.values
lat = maps.latitude.values

time = (time.astype('datetime64[h]') - np.datetime64('2019-01-01')).astype(int)
Nt = time[-1]

u_maps = maps.ugos
v_maps = maps.vgos
4. Independant drifters
4.1 Download drifters
[7]:
path_drifters = '../data/independent_drifters/uv*'
ds_drifters = xr.open_mfdataset(path_drifters,concat_dim='time',combine='nested')
ds_drifters
[7]:
<xarray.Dataset>
Dimensions:    (time: 2156405)
Coordinates:
  * time       (time) datetime64[ns] 2019-01-01 ... 2019-12-31
    latitude   (time) float32 dask.array<chunksize=(5559,), meta=np.ndarray>
    longitude  (time) float32 dask.array<chunksize=(5559,), meta=np.ndarray>
Data variables:
    EWCT       (time) float32 dask.array<chunksize=(5559,), meta=np.ndarray>
    NSCT       (time) float32 dask.array<chunksize=(5559,), meta=np.ndarray>
    sensor_id  (time) float64 dask.array<chunksize=(5559,), meta=np.ndarray>
Attributes: (12/46)
    data_type:                   OceanSITES trajectory data
    format_version:              2.0
    platform_code:               116275
    date_update:                 2020-10-13T12:17:40Z
    institution:                 AOML
    institution_edmo_code:       1799
    ...                          ...
    deployment_lat:              -58.44
    last_longitude_observation:  82.75
    last_latitude_observation:   -18.49
    date_drog_lost:              2017-01-21T03:37:00Z
    death_type:                  stop transmitting
last_date_observation: 2019-01-16T01:51:00Z4.2 Prepare drifter data
[8]:
%%time
ind, time_drifter, lon_drifter, lat_drifter, id_drifter= prepare_drifter_data(ds_drifters,maps)
CPU times: user 1min 54s, sys: 15.9 s, total: 2min 10s
Wall time: 2min
5. Interpolate maps at drifters locations
[9]:
%%time

# Create interpolation function
fu = RegularGridInterpolator((time, lat, lon), u_maps.values)
fv = RegularGridInterpolator((time, lat, lon), v_maps.values)
CPU times: user 30.4 s, sys: 12.4 s, total: 42.8 s
Wall time: 49.7 s
6. Artificial drifter trajectories
6.1 Trajectory parameters and initialization
[10]:
nday = 5
dt_h = 24
mode = 'euler'
write = False
Np = time_drifter.size

horizons = np.arange(0,nday*24/dt_h+1)

dict_drifter_adv_maps = {0:{'time':time_drifter,
                           'lon':lon_drifter,
                           'lat':lat_drifter,
                            'id':id_drifter}
                       }
horizons
[10]:
array([0., 1., 2., 3., 4., 5.])
6.2 Compute trajectories
[11]:
%%time
dict_drifter_adv_maps = compute_traj(dict_drifter_adv_maps, horizons, fu, fv ,Np, Nt, dt_h, method_name, dir_out, prefix_out, mode, write)
h 1.0
h 2.0.0
h 3.0.0
h 4.0.0
h 5.0.0
CPU times: user 143 ms, sys: 644 ms, total: 787 ms
Wall time: 1.23 s
7. Compute deviation
[12]:
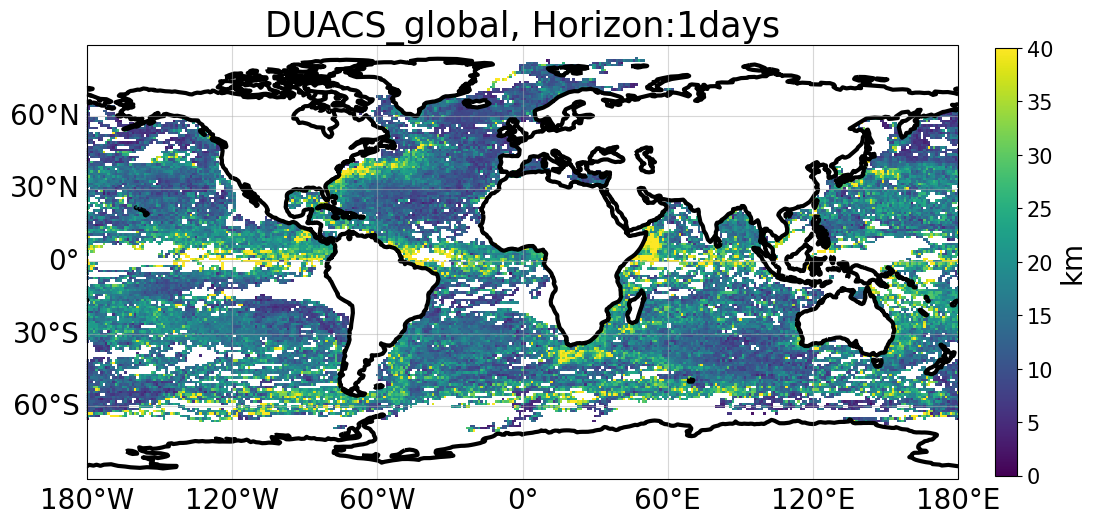
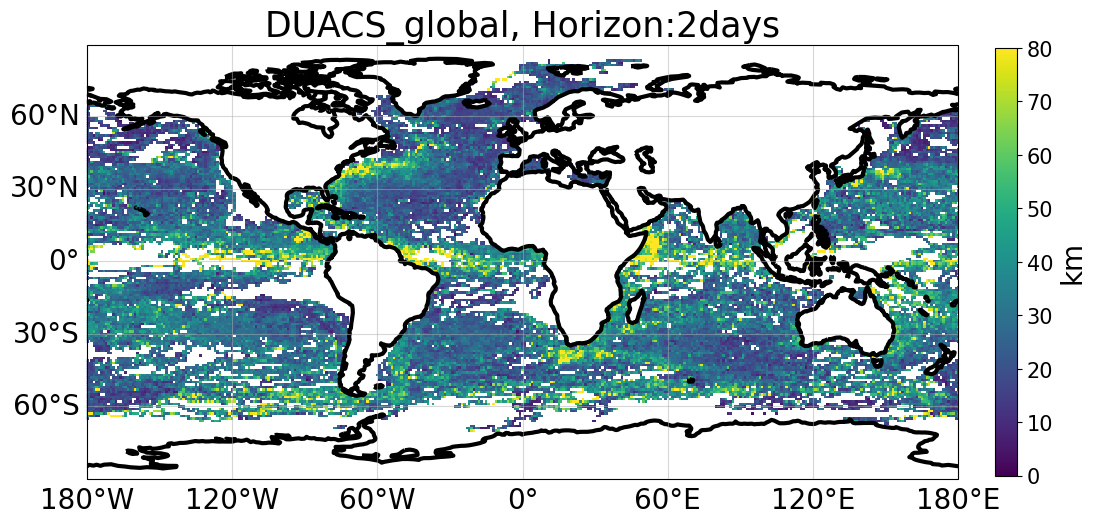
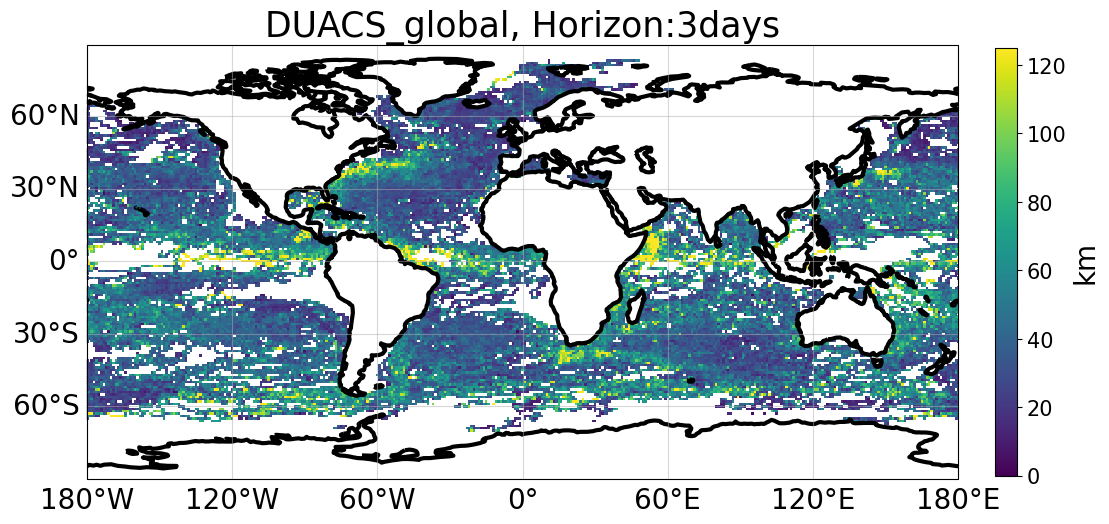
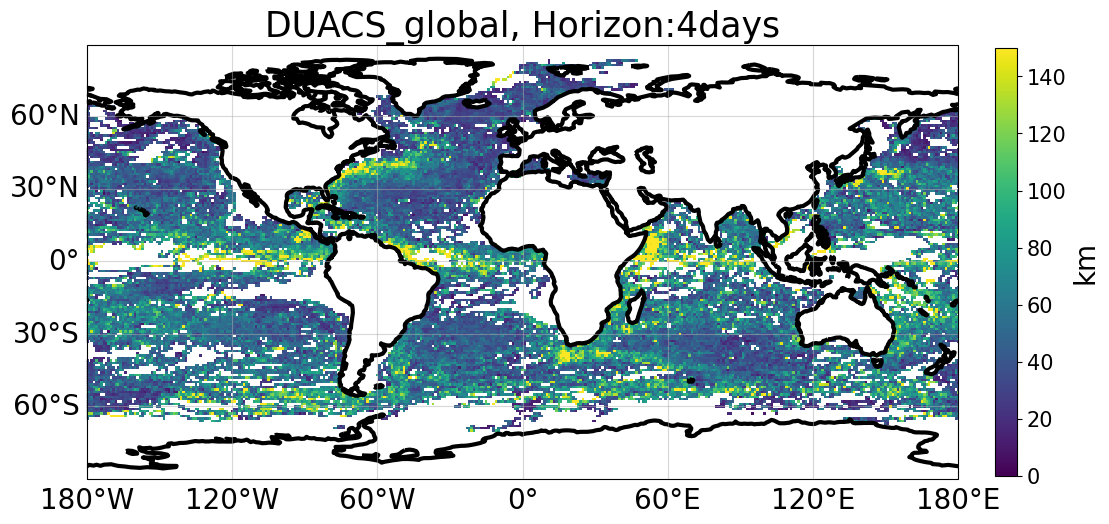
# Deviation = Cumulative distance between artificial and real trajectories

# Average deviation by bins
lon_out=np.arange(lon_min, lon_max, 1)
lat_out=np.arange(lat_min, lat_max, 1)

horizon_days = [1,2,3,4,5]

dev_maps, var_dev_maps, dmean = compute_deviation(dict_drifter_adv_maps, Nt, dt_h, horizon_days,lon_out,lat_out, dir_out, method_name, results_out)
8. Plots
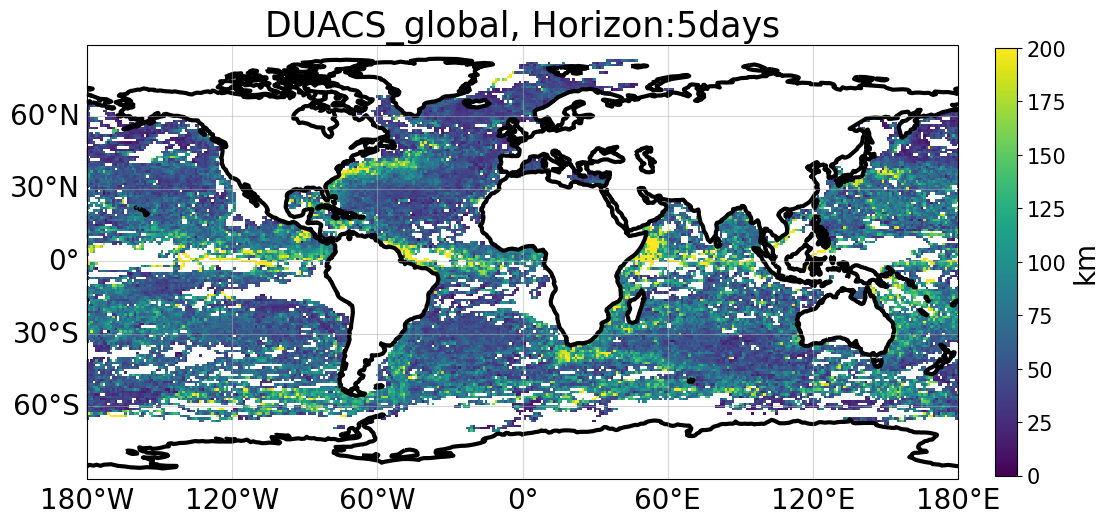
8.1 Plot deviation maps at different horizons
[13]:
horizon_plots = [1,2,3,4,5]
horizon_plot_max = [40,80,125,150,200]

plot_traj_deviation_maps( lon_out, lat_out, dev_maps, dt_h,horizon_plots,horizon_plot_max,method_name)
8.2 Plot spatially averaged deviation as a function of horizons
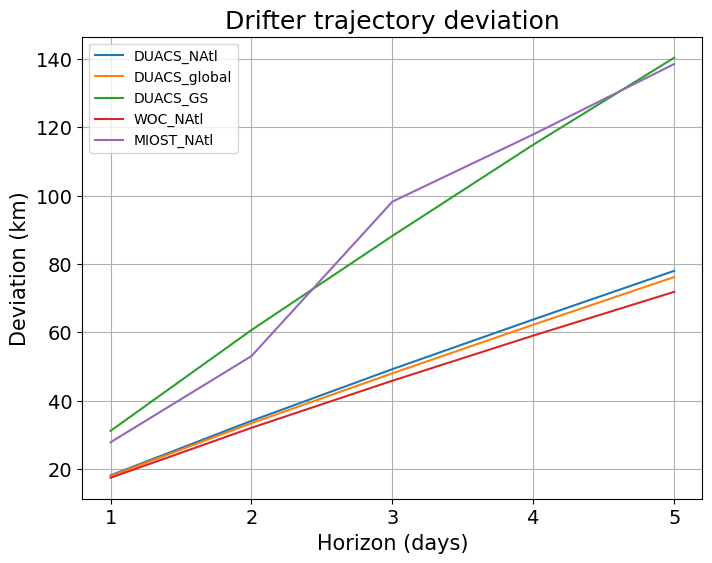
[14]:
plot_meantraj_deviation(dir_out)
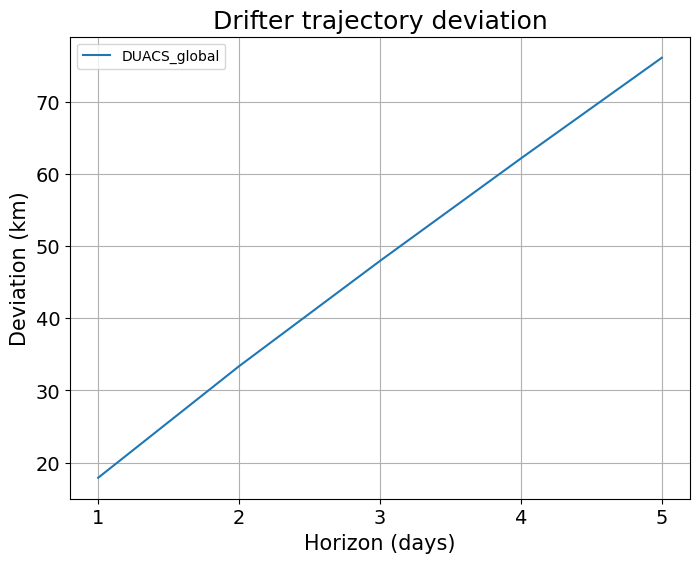
[15]:
plot_meantraj_deviation(dir_out, just_basin='global')
[ ]: